
A lot of time and effort has gone into the creation of each work showcased on this blog. If you wish to use any of the graphics or photographs, kindly contact Mayank for permission.
Over the years, several people got in touch with requests to use graphics featured on this website, and for some wonderful purposes! Here is how some of the artworks have been used or published:
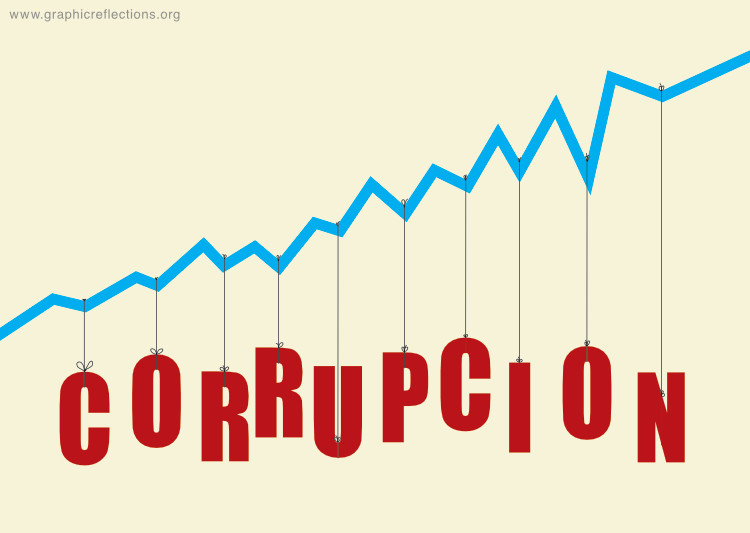
Corruption Impedes Progress
This graphic was translated into Spanish and used in issue 19, volume 5, of Revista Futuros, an electronic magazine promoting dialogue on sustainable development in Latin America and the Caribbean, published by the American Friends Service Committee. Revista Futuros were also very kind to publish a short writeup about this website along with the graphic. (November, 2007)
Development vs Population
This graphic was used by Mr. Sriram V. at a talk titled India: Myth or Reality at the American Chamber of Commerce in Tokyo, Japan. (May 2010)
Environment on Low Battery and Trees Give Oxygen
These graphics were used by Hyemin Lee, a National University student majoring in Public Administration in Jeju, South Korea, in a report titled Jeju Green Stamp Project, aiming to protect Jeju’s environment and promote sustainable tourism. (August, 2009)
I Hate This, I Hate That
Previous version of this graphic was used by award-winning spirituality and ethics columnist Douglas Todd in an article titled Hate expands when people feel shrunken. The article was published on his blog at The Vancouver Sun website. (February, 2009)
Invasion
This graphic was originally created for and displayed at Invasions, a group show of posters curated by Dr. Nuzhat Kazmi, held at Palm Court art gallery, India Habitat Centre, New Delhi, in May 2003.
Earlier version of this graphic was printed in the introduction (Raga India: Architecture in the Time of Euphoria) of Architectural Design magazine, November – December 2007 issue, published by John Wiley and Sons. Titled Made in India, the issue was guest edited by Kazi K Ashraf.
This graphic was also used by the Australian Council for Educational Research (ACER) and Victorian Curriculum and Assessment Authority (VCAA), Australia, in an examination / test and on the VCAA website for the purpose of demonstrating a selection of items used in the final version of the Victorian General Achievement Test. (2009, 2021)
Life Span of a Littered Plastic Bottle
This graphic was used by Beth Richter at the Department of Science, Hamden Hall School, CT, USA, in classroom sessions about consumption and waste for middle and high school students. (September 2010)
Life Span of a Littered Plastic Bottle, Trees Give Oxygen and Water Scarcity
These graphics were displayed, along with artworks by many other artists, during SARA Centre’s community action program Western Ghats Eco Walk. It was held between June 5 and 8, 2018, in Karnataka, India.
Manhattan (After September 11)
This graphic was printed in the ‘Creative Corner’ section of The Advertising Brief, October 4, 2001 issue. The Brief was one of India’s leading publications on advertising, published for Mid-Day Multimedia Ltd, Mumbai. (October, 2001)
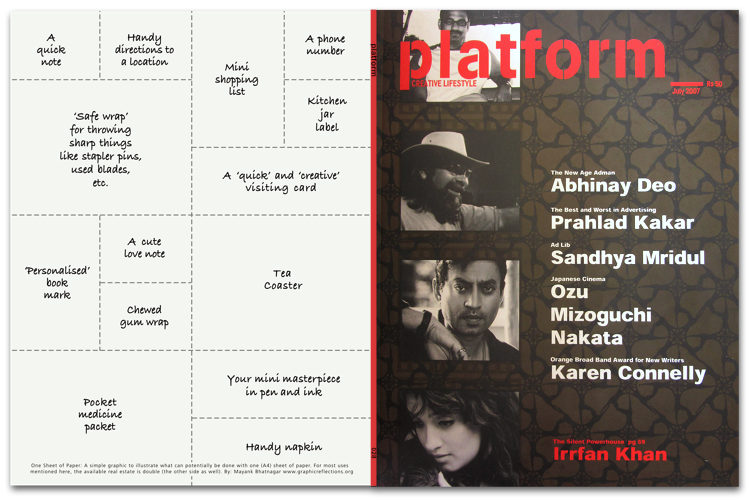
One Sheet of Paper
Previous version of this graphic was adapted for and printed on the back cover of July 2007 issue of Platform, a magazine on creative lifestyle.
Sustainable Development, Ideally
Older version of this graphic was used by Michele Ferenz, Senior Adviser at UNICEF headquarters in New York, USA, in a presentation to senior leadership of UNICEF titled Environmental Sustainability. (September 2012)
This graphic was also used by Sayaka, Masters for Urban and Regional Planning program student at University of California, Irvine, USA, in a professional report titled Creating Sustainability Indicators for the City of Los Angeles. The Professional Report (PR) was equivalent to an MA thesis. (December, 2007)
Time: Drags and Flies
Previous version of this graphic was used by Adrian Iveson, Global Sr. Director, Consumer & Customer Insights, Campbell Soup Company (NJ, USA), in a presentation to her team about dealing with time pressures in marketing. (February, 2010)
Usage in a High School
Several graphics featured on this website were used as part of the Year 11 Geography curriculum, by Elizabeth O’Hagan, a Geography and Social Studies teacher at Aorere College, Auckland, New Zealand. The artworks were used in the classroom, where students practiced interpreting graphics, cartoons, etc., and also on two Wikis developed by Elizabeth. (April, 2007)